Web reporting functionality in CodeCharge Studio provides a great way to present or print data in detailed and grouped formats with automatically calculated fields. Reports can be based on single or multi-table queries as the data source. The query used as the basis of a report can return either detailed or grouped data. In most cases the detailed data is used and you create the necessary groupings within the report's design.
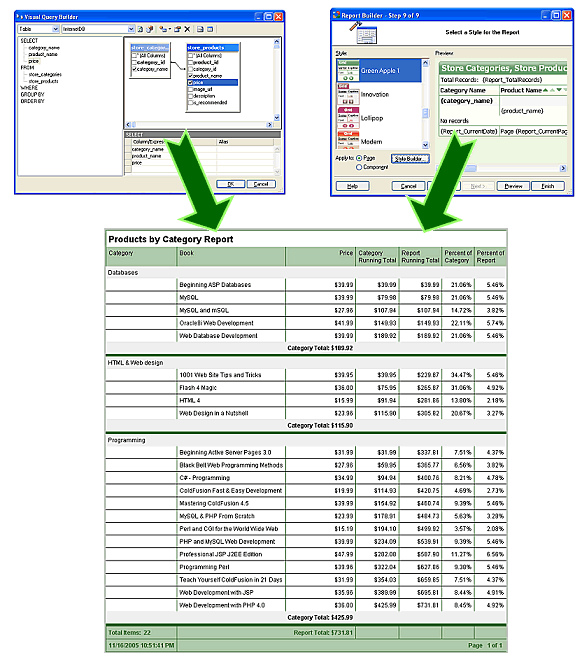
You can quickly create different types of reports using the Report Builder and later customize the report in the Design or HTML mode and modify the properties of the report, individual report sections, or controls placed within those sections.
CodeCharge Studio generates reports as a set of HTML files and files containing the programming code that makes up the report engine. The HTML representation of a report can be modified in the design mode, or in the HTML mode by adjusting the underlining HTML code. At run-time the report engine loads the HTML template, replaces the dynamic control placeholders with dynamic data, and outputs the page to the Web browser.
It is assumed that reports will often be used for presenting hierarchical, grouped data, where the report engine rather than an SQL query performs the grouping. Each group is based on one field, which can be selected in the Report Builder or in a report's "Group" property. When report groups are used, the data rows will be grouped into collections with the same value of the grouped field in each collection. Each group also has a unique name, associated group field, and the data sort order. After creating a new group the Group Header and Group Footer sections will automatically be added into the report's HTML template.
The Report component supports two display modes: Print and Web. In Web mode the report contains navigation links or buttons that users can click to navigate through multiple report pages. In Print mode all report pages are shown at once in the Web browser, however, report pages are separated by invisible page break tags that result in page breaks between printed pages when a user prints the report. Page breaking is implemented by inserting the Panel component into the Page Footer section. The Panel contains the HTML paragraph tag <p> with the "PAGE-BREAK-AFTER: always" style attribute.
Note: The report mode can be specified dynamically at run-time by including in the URL the parameter named ShowMode with the value "Web" or "Print". You can specify the default mode in report's properties.
You can specify "Lines per Web page" and "Lines per Print page" for a report, which defines the page height in Web and Print modes respectively. In Web mode the "Lines per Web page" value is used to determine where to end the page and display the page footer and the navigator. In Print mode the "Lines per Print page" value is used to determine where to end the page and show the page footer and the page break tag. The "Line" is an abstract unit used because Web applications are not aware of the true pixel height of a report that is being output. Some of the reasons for this include:
It is left to the developer to determine the exact or approximate height of the report that should be output, either in true units like pixels or abstract units like rows or lines. Once you decide on a specific unit type to use you will need to determine and assign the height to each report section and specify the total number of units (lines) that the report should display on each page. You may need to experiment with various section heights and the "Lines per Web Page" until you determine the settings that work best for you and your users.
Note: The page size can be specified dynamically at run-time by including in the URL the parameter named <Report Name>PageSize with the value that specifies the requested page size. You can limit this value in Web mode by specifying the "Page Size Limit" in report's properties.
The reporting engine supports the dynamic data sorting functionality via the Sorter component. Users can change the sort order by clicking the sorter links or buttons. The sort order does not apply to groups and the data can be dynamically sorted only within a group.
A report form is used to present or print data. It does not have built-in functionality to insert, update or delete database records. If you need to perform any of these operations consider using a record form or an editable grid. In addition to displaying multiple data records a report facilitates operations like sorting the records based on different columns in the report or browsing multiple pages when the data to be displayed spans more than one page. Due to their internal complexity report forms are usually constructed using the Report Builder. In terms of HTML markup, a grid form is made up mainly of an HTML structure with different controls.
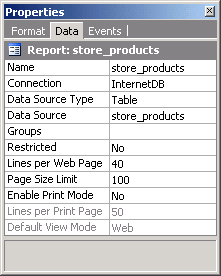
Once you create a report, usually with the Report Builder, you may further customize the report behavior by changing its properties. You can also change properties of individual report sections by selecting them in the Project Explorer panel.
| Property | Description |
|---|---|
| Name | Identifier name used in the generated code and HTML template. |
| Connection | Database connection name to be used for retrieving report data. |
| Data Source Type | Type of the data source that provides the data for the form, such as a table, stored procedure or SQL. |
| Data Source | Table/view, SQL statement or stored procedure that the report is based on. |
| Groups | List of report groupings and sections. Click the [...] button to maintain the report groups or view its sections. |
| Restricted | Whether to use authentication based on security access groups. Click the [...] button to specify user groups that can view the report. The report will be hidden from all other users. |
| Lines per Web Page | The height of the report page displayed in a Web browser, measured in abstract line units assigned to each report section. Refer to Report_Paging section of the documentation for more information. |
| Page Size Limit | Maximum number of line units shown on the page in Web view mode. |
| Enable Print Mode | Allow the report to be executed in print mode. When in print mode, the report will show all report pages on one screen so users can print it from their Web browser. |
| Lines per Print Page | The height of the report page to be printed, measured in abstract line units assigned to each report section. Refer to Report_Paging section of the documentation for more information. |
| Default View Mode | Default report view mode: Web or Print. In Web mode the application will use the "Lines per Web Page" property to display a specific number of records per page. In Print mode the application will use the "Lines per Print Page" property to display a specific number of records per page, while all report pages will be shown on one screen for users to be able to print it from their Web browser. |
Every report is made up of multiple report sections where each section serves a different purpose and can be adjusted separately.
Each active report section has the following properties:
| Property | Description |
|---|---|
| Name | Identifier name used in the generated code and HTML template. |
| Visible | Should the section be shown on the report page at run-time. Select "No" to hide it. |
| Height | The height of the report in abstract "line" units. You can imagine that a line is 1 pixel high and specify the true pixel height, if known. In other cases you may decide to use data rows as a "line" and specify "1" as the section height.. Refer to report properties for more information. |
The Report Label is the main control used to display data inside reports. This component is the extended version of the Label component with all its functionality, plus report specific properties. To place a Report Label within a report section, click the Label component in the Toolbox.
Report labels are similar to standard label controls; however, they contain additional properties that are report-specific. The following report label properties are available:
| Property | Description |
|---|---|
| Name | Identifier name used in the generated code and HTML template. |
| Control Source Type | The type of data source that this control should be based on. |
| Control Source | Field name or expression to be used as label's data source. |
| Format | The type of values that the label holds, such as Text, Integer, Date, etc. |
| Text If Empty | Text to display when the label's value is empty. The text can be in HTML format if "Content" property is set to "HTML". |
| Content | Select "HTML" if you would like to output the data as-is without converting it to text. Select "Text" if you like to convert HTML content to text. |
| DBFormat | Label's value format as specified in the database - it will be used in SQL statements that retrieve label's data. |
| Hide Duplicates | Whether to hide duplicate values, if you do not want to show the same value in multiple consecutive rows. |
| Function | Function to be used if you want the value to be auto-calculated. The following functions are available: Sum, Count, Min, Max, and Average. |
| Reset At | Specify when the function-based calculations should be reset - never, at page level, or at group level. |
| Percent Of | Whether the label value should be shown as percentage of a higher-level group or the report. |