 CodeCharge Studio
The Report Builder creates a report that is based on a table or query. Search/filtering functionality can also be configured here. To start the Report Builder, select it from the Toolbox panel.
The Report Builder consists of the following nine steps:
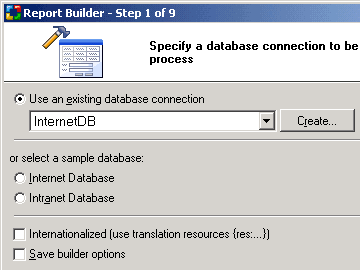
Select or create a database connection from where the data shown in the Report will be retrieved. You can select one of the existing database connections, create a new connection or select one of the sample databases. Internationalization option is also provided as described below.
| Option | Description |
|---|---|
| Use an existing database connection | Select previously configured database connection. |
| Create... | Create a new database connection. |
| Select a sample database (Internet/Intranet) | Use one of the example databases provided with CodeCharge Studio as an alternative to selecting an existing database connection.
If this option is selected the database connection will be created automatically. |
| Internationalized | Create an internationalized version of the report by using resource translation keys in place of text. |
| Save builder options | Preserve the options that you're selecting on steps 1 through 9 of the builder. The options will be automatically pre-selected the next time you use the Report Builder. |

Click Next to proceed to step 2.
| Option | Description |
|---|---|
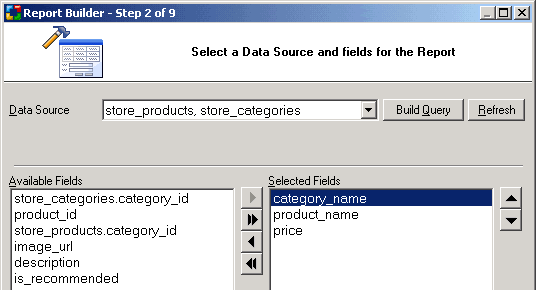
| Data Source | Specify the table(s) or view(s) for the report to be based on, or click [Build Query] to access Visual Query Builder where you can design your database query or enter an SQL query statement. |
| Build Query | Brings up the Visual Query Builder window where you can setup a SQL query that will act as the report data source. |
| Refresh | Refreshes the list of tables and fields in the database if you make changes to the database after having begun using the builder. |
| Available Fields | The list of all fields returned by the data source, which were not selected to be included in the report. The fields are removed from this section once you click on the arrow buttons to move selected fields to the right panel named "Fields for the Report". |
| Fields for the Report | The list of fields returned by the data source, selected to be included in the report. |
| Order By | Select the database field by which you'd like to order the data on the report. Select (Custom...)or click [...] to select multiple fields or specify descending order. |
Click Next to proceed to step 3.
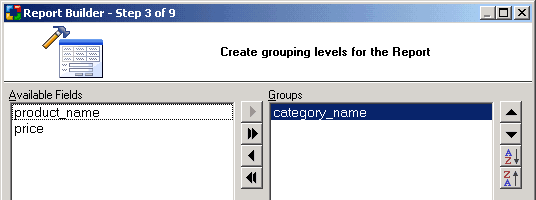
Specify the fields used for creating data groupings in the report. The inclusion of groups is not required and this step is optional.
| Option | Description |
|---|---|
| Available Fields | The list of all fields returned by the data source and selected in step 2. |
| Groups | The list of fields you selected as groups.
The report data will be grouped using this field's values. For example, the report will display the group header each time before "category_name" field's value changes, and the group footer after the field's value changes. The group footer may contain some calculated fields, for example, to show the number of items within the category. You can select multiple groups; the order of selected groups decides how the groups will be displayed and the data summarized. Higher positioned groups should reflect a higher level of grouped data. For example, you might create groups in the following order: continent, country, state/region, and city. |
| Sort Buttons (AZ) and (ZA) | Specifies ascending or descending sorting for the selected group. |
Click Next to proceed to step 4.
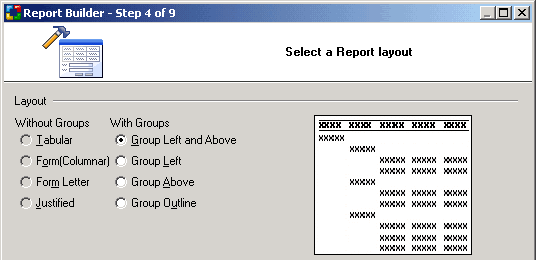
Select a report layouts, which will determine the design of the report template and placement of components inside it. The available layout options depend on if the report contains data groups or not.
| Type | Option | Description |
|---|---|---|
| Without Groups | Set of options available when you are not using any groupings in your report. | |
| Tabular | Grid-type report layout, with column captions placed within the Page Header section. | |
| Form (Columnar) | Columnar report layout, with headers placed to the left of the detail. Each data source field corresponds to one row. | |
| Form Letter | Free-form report layout, where the data is formatted based on the user specified template. The template is created in a separate builder step. | |
| Justified | Justified report layout. Each data source field corresponds to two report rows where field name is placed in a row and the data is shown in the row below it. | |
| With Groups | Set of options available when you are using groups in your report. | |
| Group Left and Above | Report layout that places group field to the left and above the 1st column of the following group or detail. Field names (captions) are placed within Page Header. | |
| Group Left | Report layout that places group field to the left of the 1st column of the following group or detail. Field names (captions) are placed within Page Header. | |
| Group Above | Report layout that places group field above the 1st column of the following group or detail. Field names (captions) are placed within Group Header. | |
| Group Outline | Report layout with indented group fields. Field names (captions) are placed within Group Header. |
Click Next to proceed to step 5.
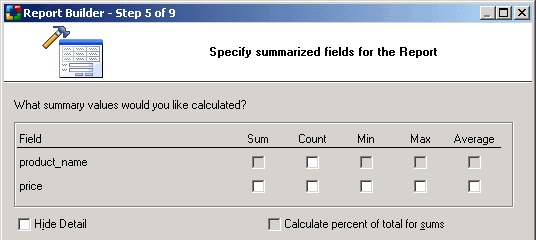
Specify the inclusion of totals and other calculated values within the report. All available math functions are enabled for numeric fields, while the Count function can be used with other types of fields. Total values will be calculated for each group and the report as a whole. Group based functions will be included in the corresponding Group Footer sections. Grand totals will be placed into the Report Footer. If Sum function is available and selected, you can also select the "Calculate percent of total for sums" option.
| Option | Description |
|---|---|
| Field | Database field on which calculations can be performed. |
| Sum/Count/Min/Max/Average | Select calculation types that you'd like to be performed for each field. They correspond to common math functions that can be used to create and include calculated fields on the report. The calculated fields will be created in the selected group's footer section. |
| Show Detail and Summary | Select this option if you'd like both the detail and summary sections of the report to be included in the report. This is a common selection. |
| Show Summary Only | This option is available in case you don't need the details to be included in the report but forgot to use the GROUP BY statement in your underlining SQL data source.
When this option is selected, the detail section of the report will be hidden programmatically. |
| Hide Detail | Hides the detail section of the report. This option doesn't need to be used unless, for example, you don't want to show detail rows and forgot or were unable to create an SQL query that performs necessary groupings. |
| Calculate percent of total for sums | Creates additional "Percent" fields below the sum fields, in the group's footer section. |
Click Next to proceed to step 6.
| Option | Description |
|---|---|
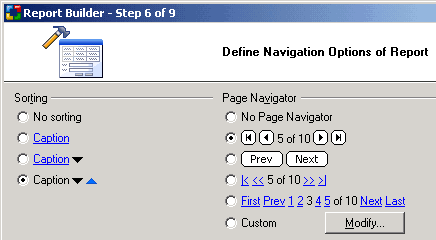
| Sorting | The type of sort options to be available above the detail columns, in the page header. |
| Page Navigator | Select the type of navigation controls to be included below the detail columns, in the page footer.
The navigator is used to navigate through report pages when all the data does not fit on one page. |
| Modify | Select Custom and then click [Modify...] to open the 'Custom Navigator' window where you can customize the controls to suit your needs. |
Click Next to proceed to step 7.
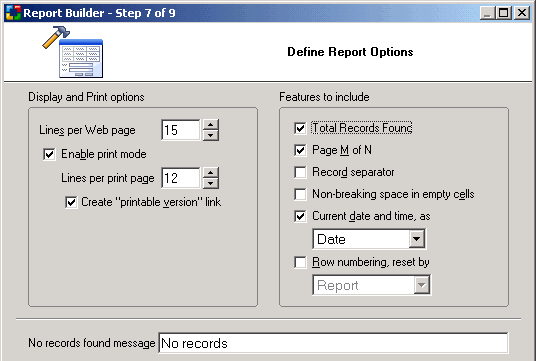
Specify additional layout and behavior options for the report.
| Option | Description |
|---|---|
| Lines per Web page | The height of the report page displayed in a Web browser, measured in abstract line units assigned to each report section. Refer to the Report Paging section of the documentation for more information. |
| Enable print mode | Makes the report available in print mode, which will display all report pages within one HTML page that can be printed. Print mode can be activated by appending "ShowMode=Print" into the URL. |
| Lines per print page | The height of the report page to be printed, measured in abstract line units assigned to each report section. Refer to the Report Paging section of the documentation for more information. |
| Create "printable version" link | Builder will create a link that users can click to view a printable version of the report.
The link will include the URL parameter "ShowMode=Print" and will be added at the top of the page above the report. It can be repositioned later. |
| Total Records Found | Displays the total number of records returned by the data source, by including a label that displays the total number of records found on your report page. |
| Page M of N | Add text to the Page Footer that displays the page number and the total number of pages, in the format "Page 1 of 5".
This option is mainly used in Print mode where the Navigator is not shown. |
| Record separator | Results in a special Panel being inserted between detail rows. This makes it easier to separate detail sections and insert a line, graphics or text between detail rows. |
| Non-breaking space in empty cells | Inserts a non-breaking space ( ) into empty report cells and "Text If Empty" property of Report Label. This option is used to improve the report layout. Web browsers often do not display cell borders if a cell is completely empty. |
| Current Date and Time, as | Displays the current date and time at the bottom of the report (in the Page Footer). You must specify if you want to display the Date, the Time, or both. |
| Row numbering, reset by | Displays a column with row numbers in the detail section of the report. You must specify if you'd like to reset row numbering at the report, page, or group level. |
| No records found message | The text to be shown when there is no data to be shown, for example, if the report's data source doesn't return any records. |
Click Next to proceed to step 8.
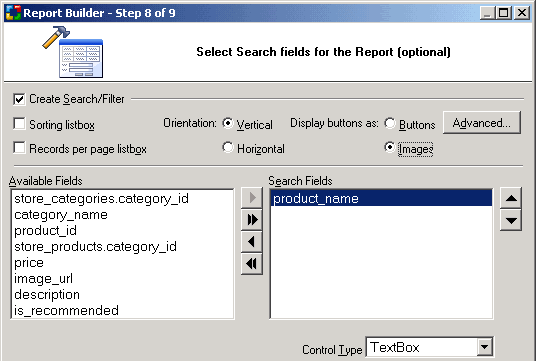
Adds a search form that can be used to filter the records displayed in the report. This step is optional. If you don't want a corresponding search form for the report click Next to proceed to the final step.
| Option | Description |
|---|---|
| Create Search/Filter | Indicates your intention to create a search form that will be used to filter the report's data. |
| Sorting list-box | Specify if you want users to be able to select the sort field for the report to be sorted by. |
| Records per page list-box | Specify if you want users to be able to specify how many records to display per report page. |
| Orientation | Specifies vertical or horizontal orientation of the search form. |
| [Advanced...] button | Specify advanced search options such as submit method, type and other properties. If AND is selected, the search form will have an input form control for all the fields.
If OR is selected, the search form will have only one input form control. Any value entered into the single control will be used to search against all the fields in the form. After you set the advanced options you can use the Preview button to view the final form with your selection. |
| Available Fields | Fields that can be included in the search form as search fields. |
| Search Fields | Fields that you selected to be included in the search form. |
| Control Type | The type of control to be used for the currently selected search field(s). |
Click Next to proceed to step 9.
Select from the list of existing styles or click Style Builder to modify or create a new theme. You can also select "(No Style)" if you don't want to use a style, or "Basic" if you don't want to use a theme at this time but would like to preserve theme compatibility for the report in the future.