Flash Chart Builder provides a visual method for designing and
including Flash charts within a Web page. The created Flash Chart component will
retrieve data from the database at run-time and present it as a visual graph.
The Flash Chart Builder provides various options for configuring the
chart's data source, style, layout, colors and captions.
The Flash Chart Builder is available under the Builders tab.
After launching the builder you will be provided with the following configurations steps.
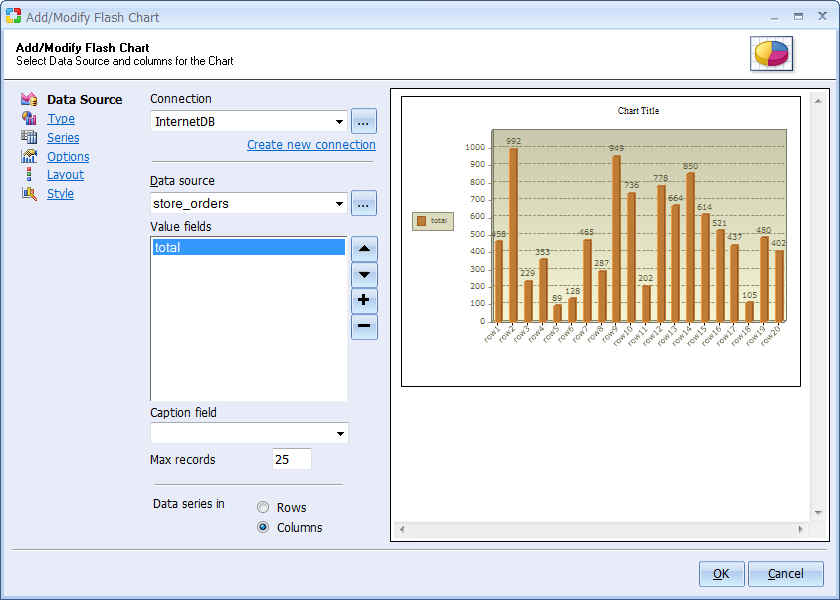
Specify a data source and fields to be charted.
| Parameter | Description |
|---|---|
| Connection | Select or create a database connection to be used to retrieve data. You can select one of existing database connections or create a new connection. |
| Data Source | Table, view, SQL query or Stored Procedure that provides values to
be charted. Click the [...] button to open the Visual Query Builder where you can design the database query or provide your own SQL statement or Stored Procedure to be used as Data Source. Sample Data Source configuration via Visual Query Builder: 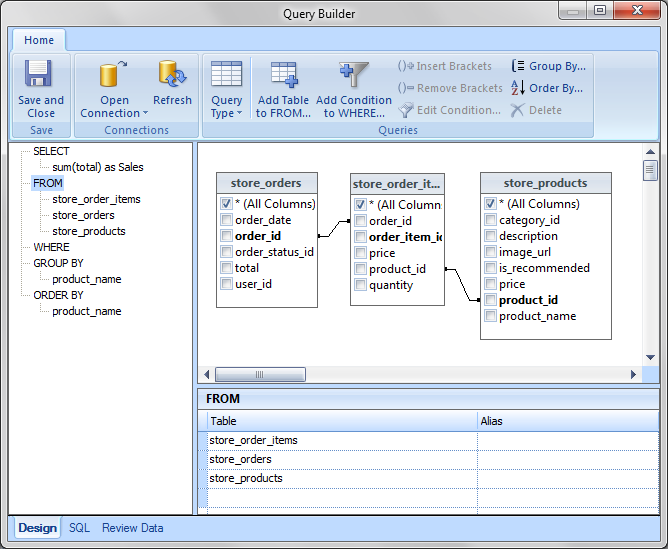 |
| Value fields | The list of available fields that can be charted, provided by the Data Source. Select fields to be presented graphically by the chart. |
| Caption field | Select field whose value contains captions for the charted data. |
| Order by | Select field by which the displayed data should be sorted. |
| Max records | Maximum number of records (values). For example you may limit the number of 20 data records to be charted. |
| Data series in | Select Rows or Columns, depending on your data series. Rows: specifies that your data series are from the rows of the data. Columns: specifies that your data series are from the columns of the data. |
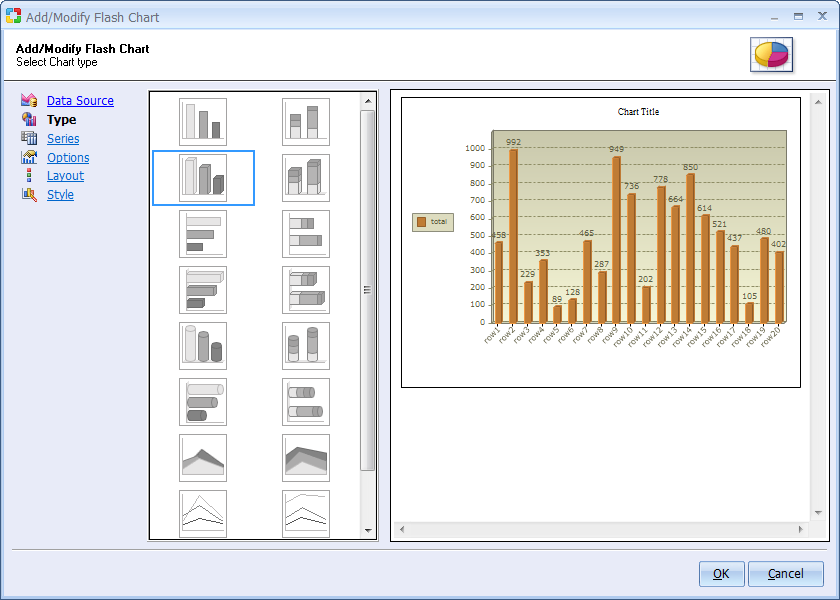
Select a type of chart that you like to use. Column, bar, linear, area and pie charts are available.
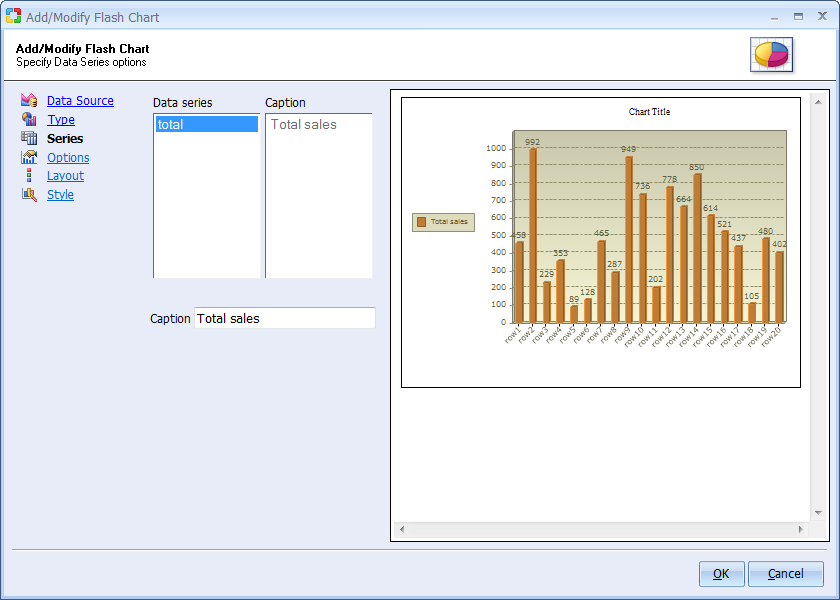
Specify captions for each of the data series to be charted.
Specify chart options.
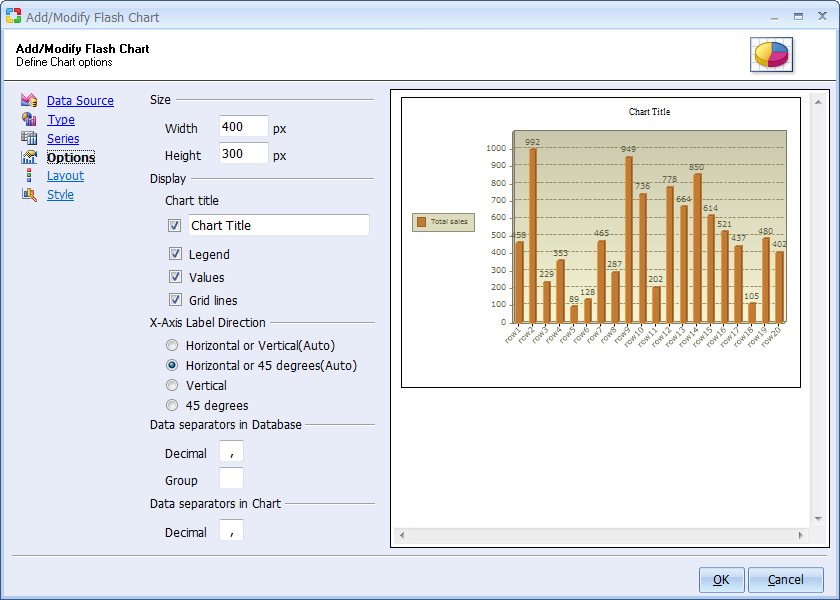
| Option | Description |
|---|---|
| Size | Desired size of the chart in pixels. Specify both width and height. |
| Chart title | Title to be shown at the top of the chart. |
| Legend | Specify whether to display the legend for data series (Y-axis) |
| Values | Specify whether to label chart values. |
| Grid lines | Specify whether to display grid lines. |
| X-Axis Label Direction | Direction of labels shown below the chart (X-axis) |
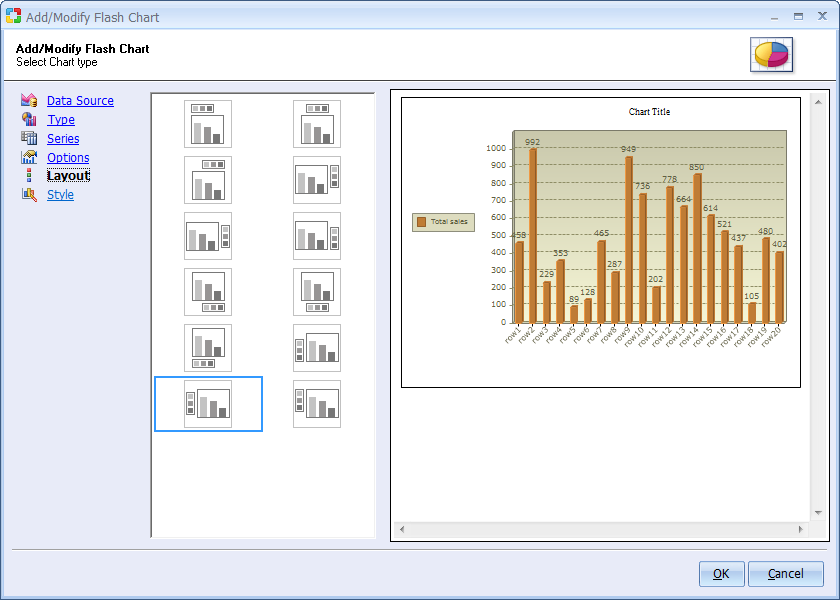
Select where and how the chart legend should be displayed.
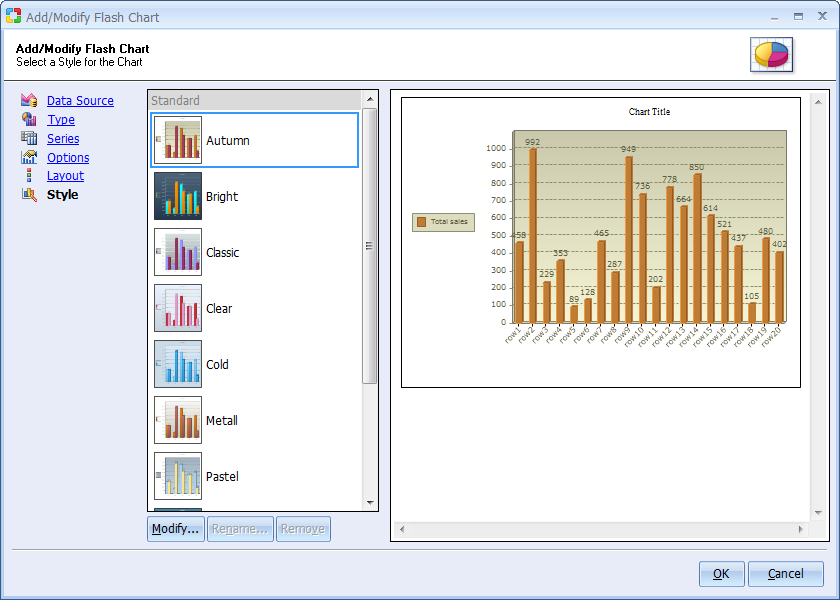
Select chart style, which controls the colors, fonts, animations and other
visual attributes associated with the chart. Styles can be reused across
multiple charts.
You can also create custom chart styles and modify them via the built-in Flash
Chart Style Builder. Select an available style and click "Modify"
to access this feature.
Flash Chart Style Builder provides global customization options for charts,
which can be reused and applied across multiple charts.
The default styles cannot be modified, however, you can click the "Save
As" button to save the current changes as a new style. The new custom
styles can be further modified and saved via the OK button.